Contrary to popular belief, a single ‘good’ Heart Rate Variability (HRV) score is a poor predictor of illness.
- True insight comes from tracking your personal baseline trend over weeks, not reacting to a noisy daily number.
- Data quality is paramount; an inconsistent measurement routine renders your HRV data useless for serious interpretation.
Recommendation: First, establish a consistent and validated morning measurement protocol. Only then can you begin to reliably interpret the trends as signals of your body’s resilience.
As a cardiologist specializing in digital health, I see a growing number of patients arriving with smartwatch data, pointing to a single, alarming Heart Rate Variability (HRV) number. You’ve likely seen the metric on your own device—a number that supposedly quantifies your recovery, stress, and readiness for the day. The common wisdom is simple: a high HRV is good, and a low HRV is bad. This oversimplification is not just unhelpful; it’s often misleading.
The data from your wrist is not a straightforward pass/fail grade for your health. It is a complex, noisy signal from your autonomic nervous system, the unconscious command center that regulates everything from your heartbeat to your digestion. Interpreting this signal to anticipate issues like burnout or illness requires moving beyond the daily score. It demands a shift in perspective from chasing a high number to understanding a dynamic pattern.
But what if the key wasn’t the number itself, but the trend against your own personal baseline? What if the most critical factor was the quality of the data you collect in the first place? The truth is that your body’s ability to handle stress—its physiological resilience—is written in the patterns of your HRV, not in a single snapshot. This is where we separate the noise from the signal.
This guide will walk you through interpreting your HRV data the way a specialist would. We will explore how to establish a reliable data collection protocol, differentiate between benign fluctuations and concerning trends, and use this powerful metric not just to track, but to actively manage your health and predict potential issues before they escalate.
To navigate this complex topic, we will break down the key components of HRV interpretation, from data collection to advanced analysis. The following sections will guide you through each critical aspect, providing the context needed to transform your raw data into actionable health intelligence.
Summary: A Deep Dive into HRV Interpretation
- Why Isometric Handgrip Exercises Drop Pressure by 10 Points?
- How to Calibrate Your Smartwatch So the Data Isn’t Garbage?
- Benign vs Dangerous: When to See a Doctor for Skipped Beats?
- The Rest Period Mistake That Prevents Cardiovascular Adaptation
- When Does a High Resting Heart Rate Indicate Impending Burnout?
- The Data Analysis Mistake That Leads to Over-Fertilization
- The Cynicism Sign That Indicates You Are Already in Trouble
- Why Slow Exhalation Physically Forces Your Heart Rate Down?
Why Isometric Handgrip Exercises Drop Pressure by 10 Points?
One of the most powerful demonstrations of your ability to influence your autonomic nervous system comes from a surprisingly simple exercise: the isometric handgrip. This isn’t about building forearm strength; it’s a targeted intervention to improve vascular function and modulate your body’s stress response. When you sustain a sub-maximal muscle contraction, you trigger a unique physiological cascade. Initially, the exercise causes a temporary increase in blood pressure. However, the adaptive response to regular training is a significant, lasting reduction in resting blood pressure.
The mechanism behind this is directly tied to improving autonomic balance. The training enhances the function of the parasympathetic nervous system—your “rest-and-digest” system—while dampening the overactivity of the sympathetic “fight-or-flight” system. Research confirms this powerful effect; a 2024 study demonstrated a 15.5 mmHg reduction in systolic blood pressure in older adults after a consistent training program. This is a change comparable to some first-line hypertension medications.
For those tracking HRV, this translates into tangible data. Following a 30-day isometric handgrip protocol, studies show a decrease in sympathetic markers and a significant increase in parasympathetic markers within HRV data. Essentially, you are training your body to be less reactive to stress and more efficient at returning to a calm state. This demonstrates that metrics like blood pressure and HRV are not fixed but are dynamic and can be actively improved through targeted, non-pharmacological interventions.
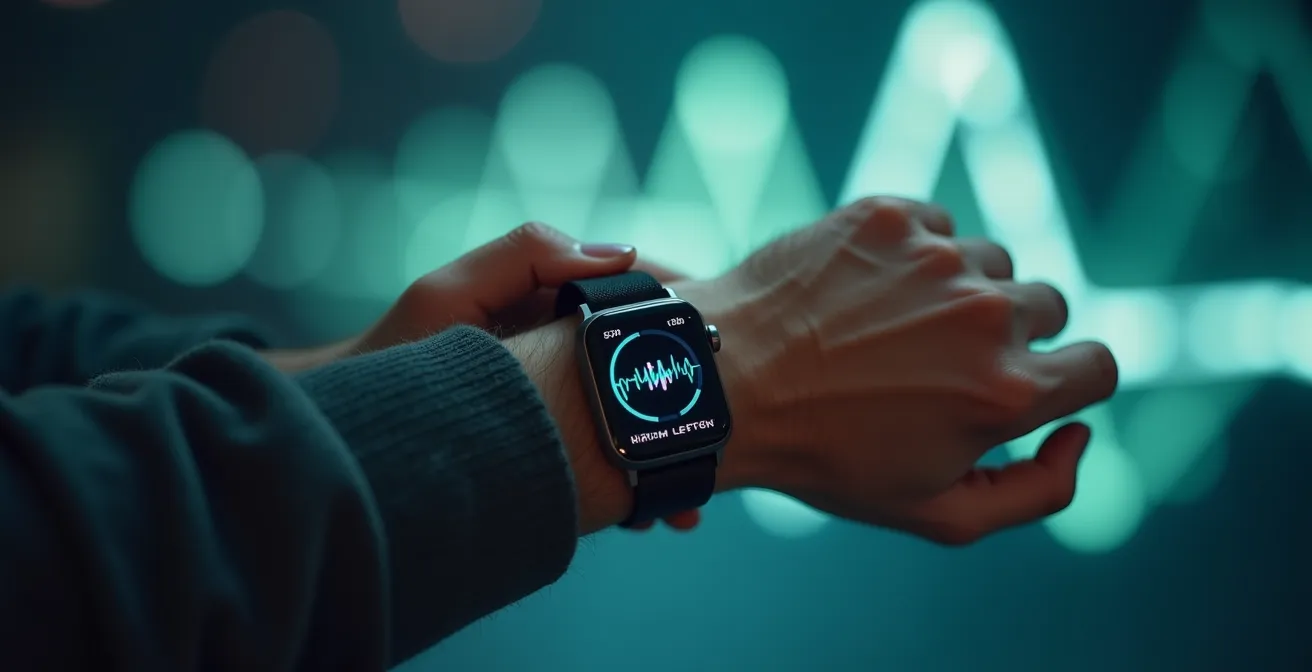
How to Calibrate Your Smartwatch So the Data Isn’t Garbage?
Before you can interpret any HRV data, you must first ensure its quality. The most common error in personal health tracking is what we call “garbage in, garbage out.” Your smartwatch’s optical sensor is sensitive and prone to artifacts from movement, poor fit, or even skin tone. To get a clean signal from the noise, you need a rigorous and repeatable measurement protocol. This process is less about calibrating the watch itself and more about calibrating your routine.
The gold standard for this is to compare your watch’s reading against a more reliable device, like a chest strap heart rate monitor, for a few sessions. However, the most crucial factor is consistency. The validated protocol for meaningful HRV data involves a specific morning routine: measure for 1-2 minutes, immediately upon waking, while sitting in an upright position. This seated posture introduces a mild orthostatic stressor, making the data more sensitive to changes in your physiological stress levels, which is particularly valuable for detecting overtraining or impending illness.

As the image suggests, this calibration is a focused moment. During the measurement, you should limit movement, breathe naturally, and avoid actions like yawning or swallowing, which can create artifacts in the data. While a chest strap offers higher fidelity, the goal is to find a routine that makes your wrist-based device as reliable as possible. The accuracy of different methods varies significantly, and understanding where your device stands is key, as a recent comparative analysis shows.
| Method | Accuracy | Key Considerations |
|---|---|---|
| ECG Gold Standard | 100% baseline | Medical-grade, requires electrodes |
| Chest Strap (Polar H10) | 98-99% correlation | Excellent for calibration reference |
| Camera-based (validated apps) | 95-97% correlation | Requires stable positioning, good lighting |
| Wrist-based optical | 85-95% correlation | Varies with skin tone, movement artifacts |
Action Plan: Your Morning HRV Measurement Protocol
- Timing is everything: Measure immediately upon waking, before checking your phone, drinking coffee, or getting out of bed.
- Position consistently: Sit upright on the edge of your bed for 1-2 minutes. Do not lie down. This ensures the same orthostatic stress each day.
- Ensure a good fit: Your watch should be snug enough that the sensor maintains constant skin contact, but not so tight it restricts blood flow.
- Minimize artifacts: Remain still and breathe naturally during the measurement. Avoid talking, yawning, or significant movements.
- Log context: Mentally note or journal any unusual factors from the previous day (e.g., alcohol, poor sleep, intense stress) to help interpret deviations.
Benign vs Dangerous: When to See a Doctor for Skipped Beats?
A common and often frightening sensation is feeling your heart “skip a beat.” These are typically premature ventricular contractions (PVCs) or premature atrial contractions (PACs)—extra, early heartbeats that are usually benign. For most healthy individuals, occasional palpitations are harmless. However, when they become frequent, sustained, or are accompanied by symptoms like dizziness, shortness of breath, or chest pain, they warrant medical attention. HRV can serve as an important contextual layer in assessing this risk, but it is not a diagnostic tool on its own.
A chronically low HRV indicates a state of sympathetic dominance, where your body’s “fight-or-flight” system is in overdrive. This state can increase the irritability of heart muscle cells, making ectopic beats more likely. While a single low HRV reading is not a cause for alarm, a persistent downward trend in your personal baseline over weeks or months, especially if it coincides with an increase in palpitations, is a significant signal. It suggests your body’s physiological resilience is low and your autonomic nervous system is dysregulated.
From a clinical perspective, the concern level rises when low HRV is combined with other risk factors. Research in neurological disorders shows that low HRV is associated with a 5.3 times higher risk of cardiac mortality. This does not mean low HRV causes mortality; it means it is a powerful marker of a body struggling to maintain autonomic balance. If you experience frequent skipped beats and your HRV trend is consistently and significantly below your normal range, it is time to consult a physician. Your data can provide valuable context for that conversation.
The Rest Period Mistake That Prevents Cardiovascular Adaptation
For tech-savvy individuals engaged in fitness, one of the biggest mistakes is following a rigid training plan without listening to the body’s daily feedback. The most common error is ignoring the data on rest and recovery, leading to incomplete cardiovascular adaptation. You might feel fine, but your nervous system may be screaming for a break. Pushing through on a day of low physiological resilience not only increases injury risk but also sabotages the long-term gains you’re working for. True adaptation doesn’t happen during the workout; it happens during recovery.
HRV is the most direct window into this recovery process. Instead of guessing, you can use your daily morning HRV reading to guide your training for the day. This is a concept known as HRV-guided training. The rule is simple: if your morning HRV is within or above your normal baseline range, your body is resilient and ready for a high-intensity session. If your HRV is significantly below your baseline, your sympathetic nervous system is still elevated from previous stressors. This is a clear signal to opt for a lighter, restorative session like stretching, mobility work, or easy cardio.

Ignoring this signal is the critical mistake. As an article from the Hospital for Special Surgery explains, athletes who adjust their training based on these readings optimize their long-term progress. On low HRV days, prioritizing breathwork and an earlier bedtime can actively support the parasympathetic system and accelerate recovery. This dynamic approach transforms training from a brute-force effort into an intelligent conversation with your body, ensuring that every workout builds you up rather than breaking you down. It’s about training smarter, not just harder.
When Does a High Resting Heart Rate Indicate Impending Burnout?
A high resting heart rate (RHR) on its own can be a sign of many things: dehydration, a recent workout, or even just a bad night’s sleep. However, when a persistently elevated RHR is combined with a chronically suppressed HRV, it becomes a powerful and specific indicator of impending burnout. This combination paints a clear picture of an autonomic nervous system that is stuck in a state of high alert. Think of it as driving a car with the accelerator pushed to the floor while the brakes (your parasympathetic system) have failed.
This state of sympathetic dominance means your body is continuously expending resources without adequate recovery. Your RHR is high because your heart is being constantly prodded by stress hormones like adrenaline and cortisol. Simultaneously, your HRV is low because the calming, variable influence of your parasympathetic “vagal” nerve is suppressed. The heart beats more like a metronome, losing its healthy, complex variability. A 2023 study on cardiovascular monitoring found that the combination of a high RHR and low HRV can predict burnout with 82% accuracy in some populations, making it a critical warning sign to heed.
Dr. Marco Altini, a leading expert in HRV analysis, articulates this state perfectly. His insight clarifies the underlying physiology of this dangerous combination.
The combination of elevated resting heart rate with chronically suppressed HRV represents a system stuck in sympathetic dominance without a functional parasympathetic brake.
– Dr. Marco Altini, The Ultimate Guide to Heart Rate Variability
If you see this pattern in your data—your RHR trend climbing while your HRV trend plummets for more than a week—it’s a sign that your body’s resources are critically depleted. This is not the time to “push through.” It is a biological signal to prioritize radical rest and recovery to prevent a full-blown burnout.
The Data Analysis Mistake That Leads to Over-Fertilization
In agriculture, “over-fertilization” occurs when you apply nutrients based on a single soil sample, burning the crop instead of nourishing it. The exact same mistake is made every day by smartwatch users interpreting their HRV. The single biggest error is overreacting to daily fluctuations. Waking up to a low HRV score after a night of poor sleep or a glass of wine and concluding “I’m unhealthy” is the analytical equivalent of over-fertilizing. You are mistaking short-term, explainable noise for a long-term signal.
Your HRV is meant to fluctuate daily. The key to meaningful interpretation is to ignore the daily score and focus entirely on the 7-day rolling average in relation to your long-term personal baseline. Your baseline is your “normal,” established over 30-60 days of consistent morning measurements. A single data point below this baseline is just noise. However, a 7-day average that trends significantly below your baseline for a sustained period is a true signal. It indicates a systemic stressor that is challenging your body’s resilience, whether it’s the onset of an illness, overtraining, or chronic psychological stress.

This is why the question “What is a good HRV score?” is fundamentally flawed. There is no universal “good” score. A professional athlete’s baseline might be 120ms (RMSSD), while a healthy office worker’s could be 40ms. Both are “good” for them. The only meaningful comparison is with yourself. Poor standardization in measurement makes it difficult to use the technology effectively, but focusing on your morning baseline and subsequent trends is the key. Are you trending up, down, or stable relative to *your* normal? That is the only question that matters for predicting your health status.
The Cynicism Sign That Indicates You Are Already in Trouble
When we think of poor health, we often focus on physical symptoms. But the state of your autonomic nervous system has a profound impact on your mental and cognitive state. One of the more insidious signs of chronic sympathetic overdrive—indicated by a suppressed HRV—is a shift in mindset. If you find yourself becoming increasingly cynical, irritable, or emotionally detached, it may not just be a “bad mood.” It can be a psychological symptom of a body that has lost its physiological resilience.
This connection is not just anecdotal; it’s rooted in physiology. The same autonomic dysregulation that impacts your heart’s rhythm also affects brain function. Chronic stress and a lack of parasympathetic recovery can impair prefrontal cortex activity, which is responsible for emotional regulation, executive function, and complex decision-making. In this state, your brain defaults to more primitive, reactive patterns. Cynicism becomes a cognitive shortcut—a low-energy way to engage with a world that feels overwhelming.
The data backs this up. Research reveals a strong link between autonomic function and cognitive health. A recent study reveals that chronically decreased HRV correlates with a 67% higher risk of cognitive impairment in certain populations. When you see your HRV trend line declining and simultaneously notice a negative shift in your outlook or mental clarity, treat it as a single, unified signal. Your mind is not separate from your body. That feeling of cynicism could be your brain’s way of telling you that your entire system is running on empty.
Key Takeaways
- Stop focusing on the daily HRV score; the 7-day trend against your personal baseline is the only metric that matters.
- Data quality is non-negotiable. A consistent, seated morning measurement routine is essential to get a clean signal.
- HRV is a direct measure of your autonomic nervous system’s balance. Use it to guide training, manage stress, and make informed decisions about rest.
Why Slow Exhalation Physically Forces Your Heart Rate Down?
Among all the methods to improve HRV, one stands out for its immediate, powerful, and physically mandated effect: slow, controlled breathing. Specifically, emphasizing a longer exhalation physically forces your heart rate to decrease and your HRV to increase. This is not a placebo effect; it is a direct hack into your autonomic nervous system via a mechanism known as Respiratory Sinus Arrhythmia (RSA).
Here’s how it works: when you inhale, your heart rate naturally speeds up slightly. When you exhale, your vagus nerve—the primary engine of your parasympathetic “rest-and-digest” system—is stimulated, causing your heart rate to slow down. By intentionally extending the duration of your exhale to be as long as or longer than your inhale, you maximize this vagal stimulation. You are quite literally telling your brain to apply the parasympathetic brakes. This creates a larger, more coherent oscillation in your heart rate, which is the very definition of a higher HRV.
The optimal protocol for this is often called “resonance breathing,” typically aiming for a rate of around 5-7 breaths per minute. Research published in *Psychophysiology* found that this practice can increase HRV by up to 23% in just six minutes. A simple protocol to start with is inhaling for 4 seconds and exhaling for 6 seconds. This simple, conscious act is one of the most effective ways to shift your body out of a state of stress and into a state of recovery in real-time. It’s a tool you can use anytime, anywhere, to directly improve your autonomic function.
Now that you understand the principles of accurate measurement and interpretation, the next logical step is to begin building your personal health dashboard. Start by applying the morning protocol consistently and watch your baseline emerge. This data is the foundation of proactive health management.